Hey there, traders! 🌟 Ready to learn how to plot a smart money demand and supply zone on your chart? It’s easier than you might think. Let’s break it down step-by-step so you can get it right every time!
How to Plot Plot Distal Line & Proximal Line : The Basics
Plotting a demand or supply zone involves using two horizontal lines on your chart. These lines are super important because they help you define the area where the price is likely to change direction. Here’s what you need to know about these lines:
Two Horizontal Lines
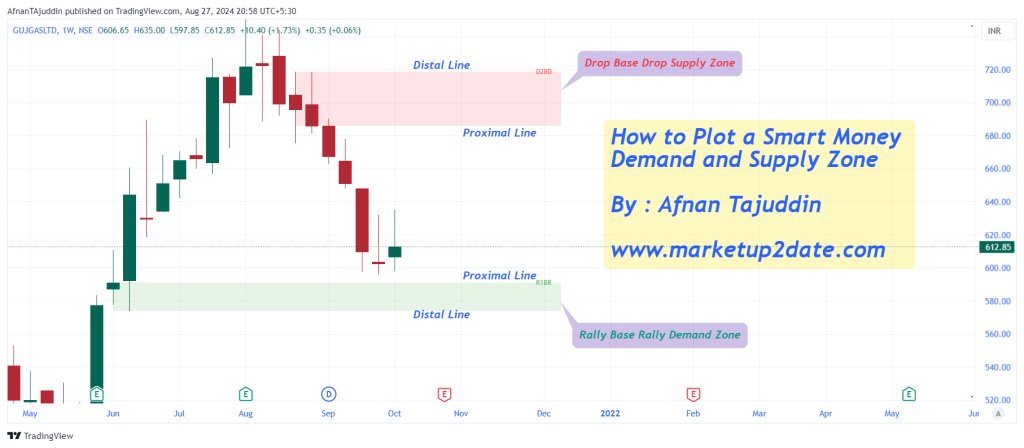
- Distal Line:
- What It Is: This is the line that is farthest from the current market price. It sets the boundary of the zone on one side.
- Where to Place It: For a demand zone, you’ll place the distal line below the current market price. For a supply zone, it goes above the current market price.
- Proximal Line:
- What It Is: This line is nearest to the current market price. It defines the other boundary of the zone.
- Where to Place It: For a demand zone, the proximal line is above the distal line. For a supply zone, it’s below the distal line.
Proximal and Distal Lines of a Zone
Let’s dive into how these lines are positioned for different types of zones:
For a Demand Zone
- Positioning: The demand zone is always found below the current market price. This means:
- Proximal Line: This line will be above the distal line.
- Distal Line: This line will be below the proximal line, further away from the current market price.
- Why It Matters: By having the proximal line above the distal line, you’re marking the area where buyers are likely to step in and push the price up after a drop.
For a Supply Zone
- Positioning: The supply zone is always found above the current market price. This means:
- Proximal Line: This line will be below the distal line.
- Distal Line: This line will be above the proximal line, further away from the current market price.
- Why It Matters: By placing the proximal line below the distal line, you’re defining the area where sellers are likely to come in and push the price down after a rise.
Plotting in Action
Let’s put it all together with a simple example:
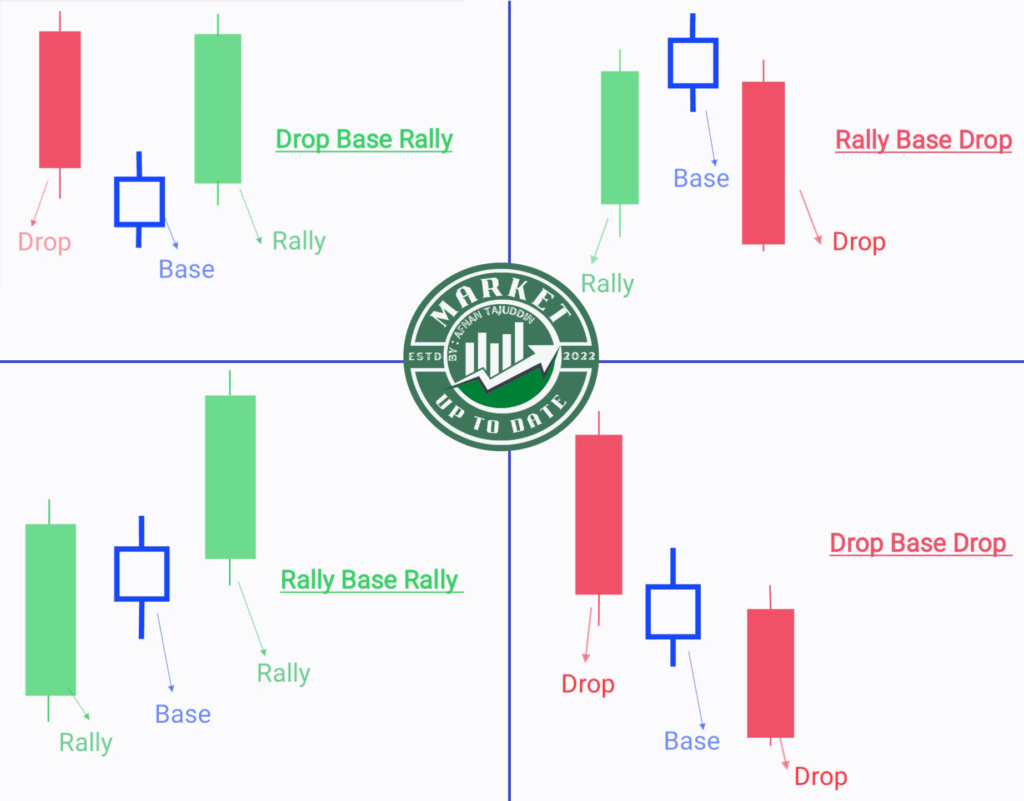
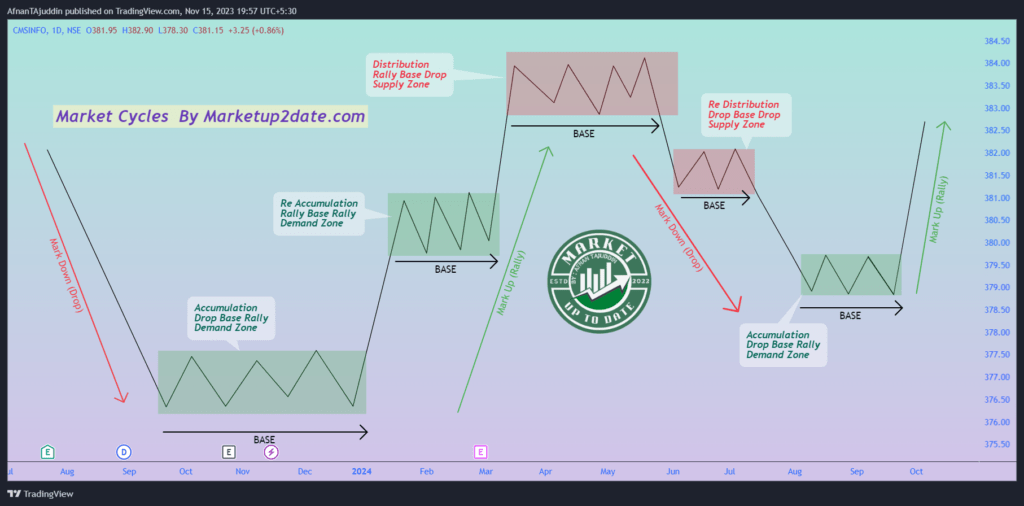
- Find the Zone: Identify where the price has shown significant movement—either a drop followed by a pause (for demand) or a rise followed by a pause (for supply).
- Draw the Lines:
- Demand Zone: Place the proximal line above the distal line, below the current market price.
- Supply Zone: Place the proximal line below the distal line, above the current market price.
- Confirm: Make sure that the lines properly enclose the area where you expect buying or selling to happen.
Don’t Worry About Plotting Zones on Your Own—We’ve Got You Covered!
But don’t stress about plotting these zones manually. We’ve got a fantastic tool that makes it super easy! 🎉 Our TradingView indicator automatically plots demand and supply zones for you. Check it out here: Smart Money Demand & Supply Zones Indicator.
The best part? It’s really affordable! You can find all the details and pricing here: Market Up2Date Pricing.
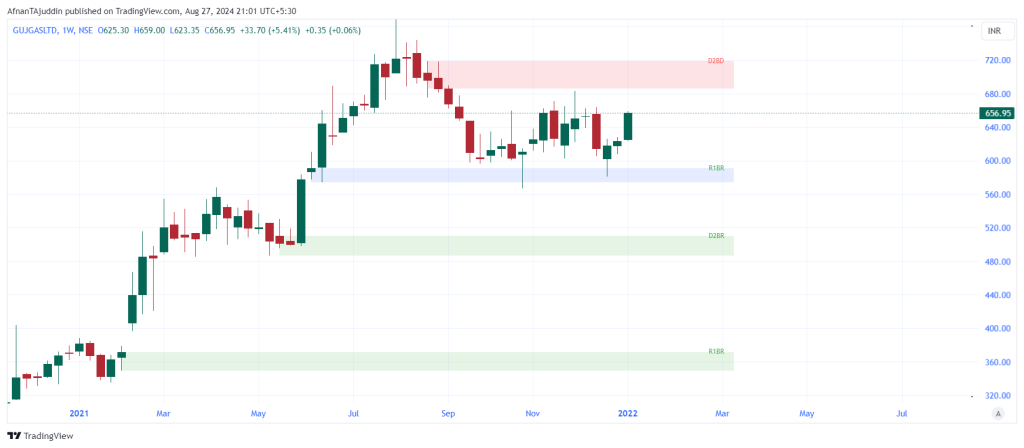
Take a look at the image above—it shows how our indicator marks the demand and supply zones on your chart automatically. So why spend time plotting them yourself when our tool can do it for you? Grab our indicator today and make trading easier! 🚀📉
Summary
To sum it up:
- Plotting a Zone: Use two horizontal lines—Distal Line and Proximal Line.
- Demand Zone: Proximal Line is above the Distal Line, found below the current market price.
- Supply Zone: Proximal Line is below the Distal Line, found above the current market price.
With our TradingView indicator, you can easily plot these zones and get accurate results without any hassle. Happy trading! 🌟📊