Hey, traders! 🌟 Ready to dive into something super cool called the Invisible Candle concept? This is a nifty trick that can help you understand those sneaky gaps in the market that might be hiding from plain sight. Let’s break it down together!
What Is an Invisible Candle?
So, what exactly is an Invisible Candle? Well, it’s like a special kind of candle that isn’t always obvious on your chart but plays a big role in market movements. Sometimes, people call it reading a gap because it’s all about spotting the spaces between price movements.
What is a Gap?
Imagine you’re reading a comic strip, and suddenly there’s a blank space between two panels. That’s kind of what a gap is in trading! A gap happens when there’s a break in the price movement of a stock, where the closing price of one candle and the opening price of the next candle are noticeably different.
Why Do Gaps Occur?
Gaps are like surprises in the market! 🎁 They usually happen because of events or news that shake things up when the market isn’t open—like overnight or over the weekend. When trading starts again, there’s a big difference between the prices of two consecutive candles, creating a gap.
How to Read Gaps
Now, how do you actually read these gaps? It’s pretty simple:
- Gap Up:

- What It Is: If the opening price of a candle is higher than the closing price of the previous candle, you’ve got yourself a Gap Up.
- What It Means: This usually means something positive happened, making people want to buy, pushing the price up.
- Gap Down:
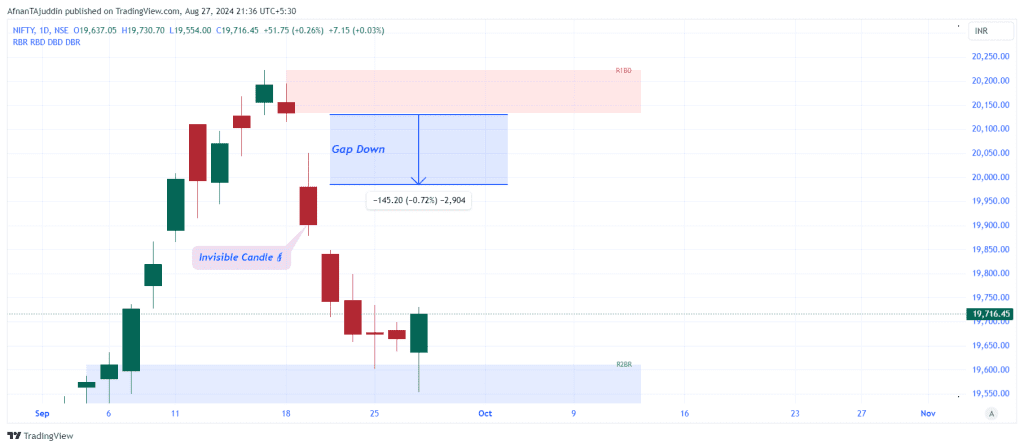
- What It Is: If the opening price of a candle is lower than the closing price of the previous candle, that’s a Gap Down.
- What It Means: This often means something negative occurred, leading to selling, which pushes the price down.
How to Read an Invisible Candle
So, what about Invisible Candles? They might sound tricky, but once you know what to look for, you’ll be spotting them like a pro!
The Body of an Invisible Candle
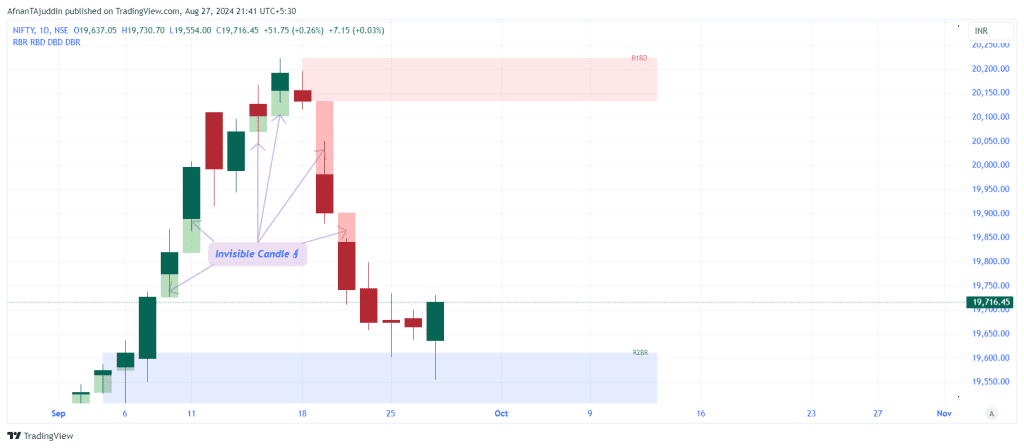
- What It Spans: The actual body of an Invisible Candle stretches from the closing price of the previous candle to the closing price of the current candle. So even if you don’t see a physical candle on the chart, the price movement between these points creates an “invisible” body.
Why It Matters
- Looks Can Be Deceiving: Sometimes, what looks like a base candle might actually be a leg candle, or a green candle might appear red—all because of the presence of Invisible Candles. They can totally change how you see the candlestick patterns!
- Drawing Zones: When you’re marking demand and supply zones, it’s super important to consider these gaps. They have a big impact on how you analyze the market and make decisions.
Making Invisible Candles Visible
Here’s the fun part—what if you could actually see these Invisible Candles on your chart? Well, you can! 🎉
Indicator Settings: Candle Rules
If you head over to the settings of our awesome TradingView indicator and turn on the “Invisible Candle” option in the Candle Rules section, these tricky candles will be marked right on your chart. How cool is that?
Avoiding Mistakes with Invisible Candles
Sometimes, an Invisible Candle can be a leg candle, and if you’re not careful, you might mistake it for a base. But no worries! Our indicator does the hard work for you. It detects these Invisible Candles and marks them, so you don’t have to stress about making mistakes. Just check out the image above to see how it works in action!
Why Choose Our Indicator?
You might be thinking, “How can I make sure I never miss an Invisible Candle again?” Well, we’ve got you covered! Our TradingView indicator is designed to make your life easier by automatically marking these Invisible Candles on your chart.
With just a few clicks, you can enable the Invisible Candle feature in the indicator settings. This not only helps you spot those gaps but also ensures that you’re making the most accurate market decisions. You won’t have to worry about mistakenly identifying a base candle when it’s actually a leg candle, or vice versa. Our indicator does all the heavy lifting for you!
Plus, this feature is just one part of our comprehensive tool that also automatically plots demand and supply zones on your chart. You can check out our indicator in action and see how it simplifies your trading strategy. Trust us, once you try it, you’ll wonder how you ever traded without it!
🎉 Our TradingView indicator automatically plots demand and supply zones for you. Check it out here: Smart Money Demand & Supply Zones Indicator.
The best part? It’s really affordable! You can find all the details and pricing here: Market Up2Date Pricing.
Summary
To wrap it up:
- Invisible Candles: These are gaps in price movement that you might not see but are super important for understanding market behavior.
- Gap Up and Gap Down: Learn to spot these gaps to understand market sentiment.
- Reading Invisible Candles: The invisible body stretches from the previous candle’s close to the current candle’s close, and they can totally change how you read your chart.
- Make Them Visible: Use our TradingView indicator to see Invisible Candles on your chart and avoid mistakes in your analysis.
With our TradingView indicator, you’ll never miss an Invisible Candle again. Turn on the feature and trade with confidence! 🚀📊