Hey there, future trading pro! 🌟 Ready to dive into the world of smart money demand and supply zones? These zones are like treasure maps for traders, showing where big price moves might happen. But don’t worry if this sounds a bit tricky—we’ll break it down step by step. And guess what? If all this seems like too much, we’ve got an awesome tool that does it all for you! Let’s get started.
What Are Demand and Supply Zones?
Before we jump into the steps, let’s quickly talk about what demand and supply zones are. Imagine these zones as areas on your price chart where the market has a high chance of reversing. In other words, it’s where big buyers (demand) or big sellers (supply) step in, causing the price to move up or down. learn more
Steps to Identify Proximal & Distal Lines of a Demand Zone
Alright, let’s first talk about how to plot the proximal and distal lines of a demand zone. These lines are super important because they help you define the zone’s boundaries. Think of them as the edges of the treasure map!
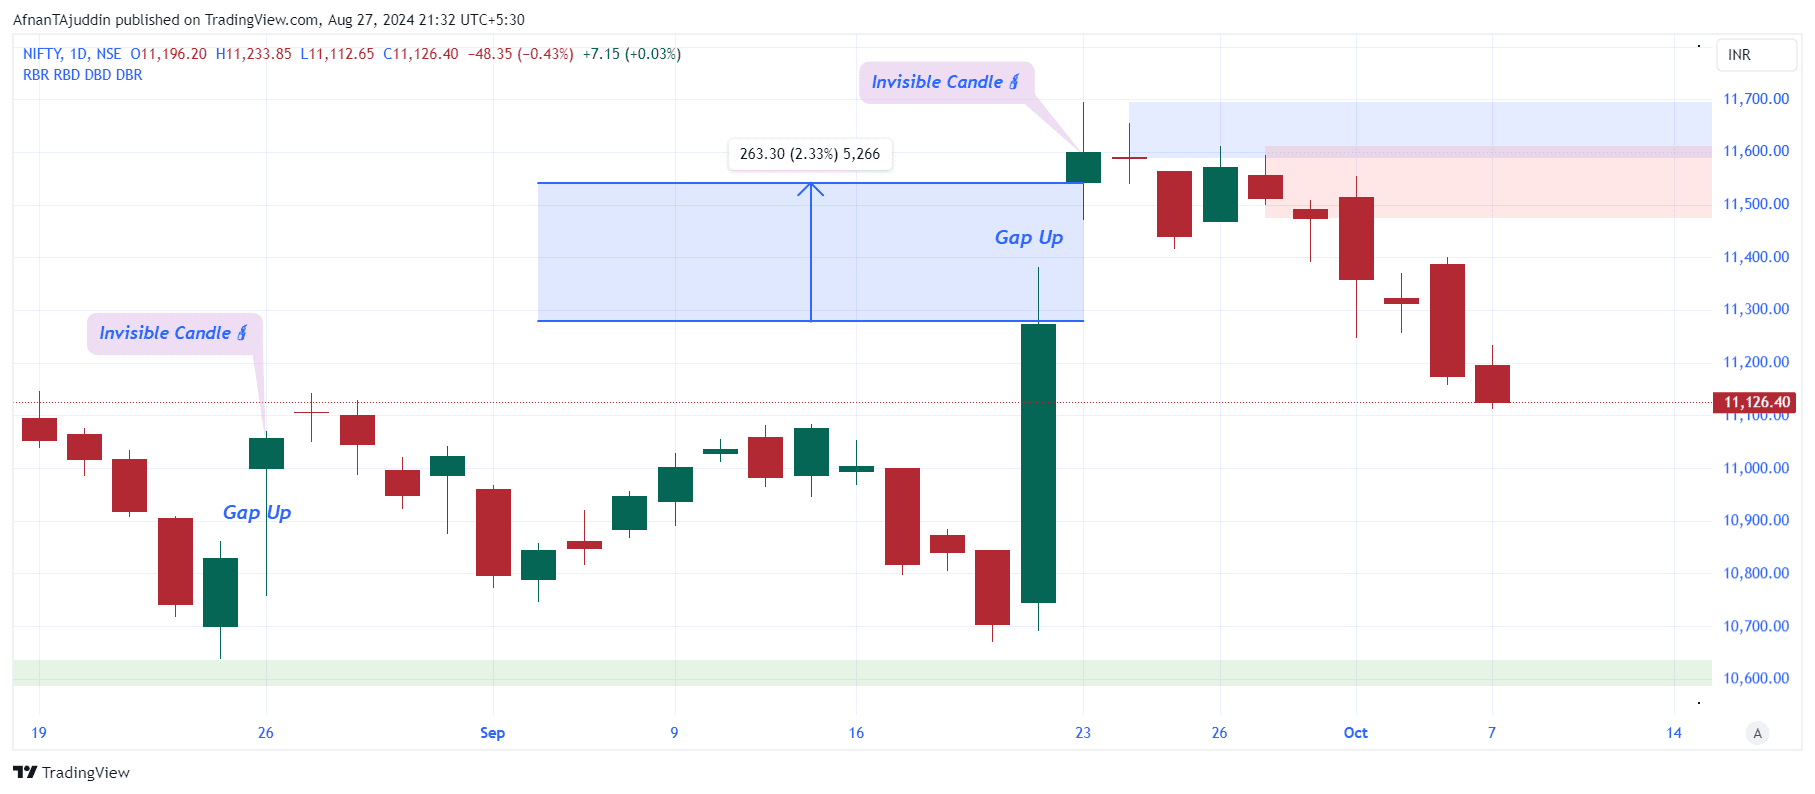
Step 1: Look for the Explosive Rally Candle
- Go from Right to Left: Start by looking at the current price on your chart.
- Start with the Current Price: From there, without cutting through any candles, look down and to the left until you find a strong (explosive) rally in price.
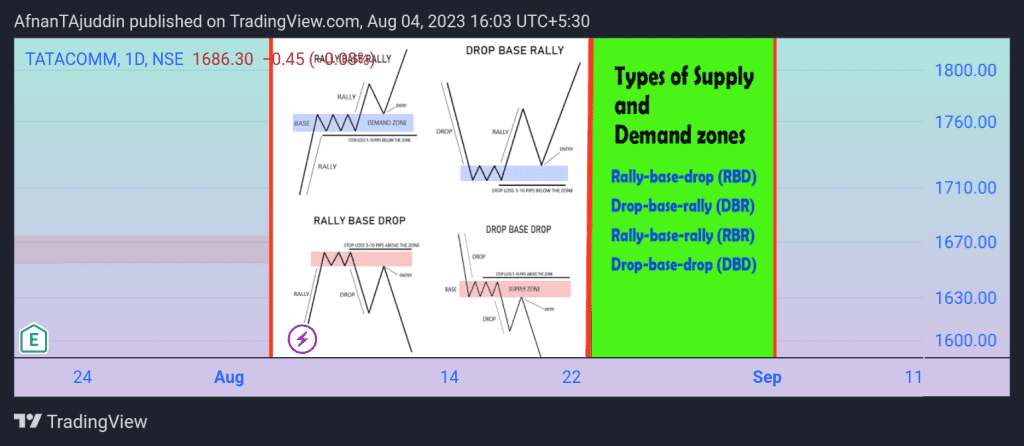
- Identify the Formation: Now, check if the formation is a Drop-Base-Rally (DBR) or a Rally-Base-Rally (RBR). This will help you know what kind of demand zone you’re dealing with.
Step 2: Check the Demand Zone Formation While Marking the Zone
Now that you’ve found the explosive rally candle, it’s time to mark the zone. Here’s what to watch out for:
- Fresh Zone: Make sure the zone is fresh, meaning it hasn’t been tested by the price before.
- Strong Leg-Out: The leg-out from the base should be strong, indicating a big move.
- Base Candles: There should be no more than six candles in the base. If there are more, the zone might not be valid.
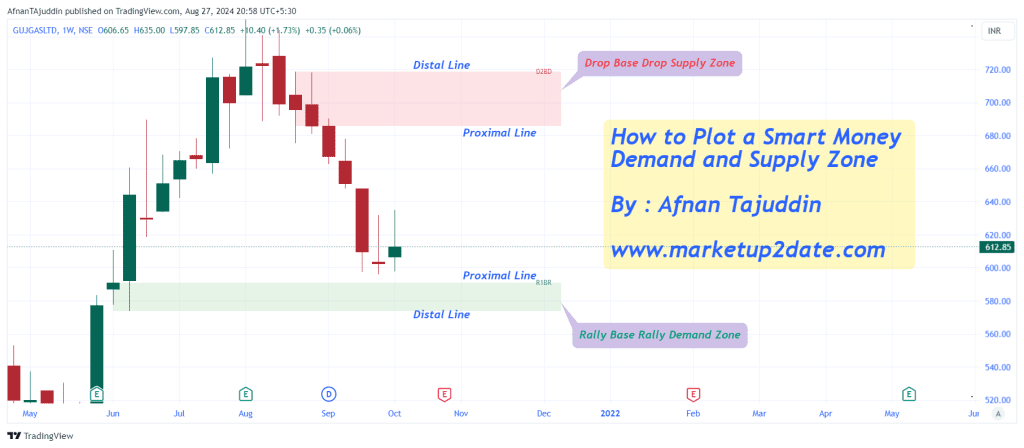
- Draw Proximal & Distal Lines: For every quality zone you find, draw the proximal and distal lines and extend them to the right.
Proximal and Distal Line Placement in a Demand Zone
Now that you’ve identified the zone, it’s time to place the proximal and distal lines. These lines are like the boundaries of the zone.
Proximal Line Placement in a Demand Zone
When placing the proximal line in a demand zone, focus only on the base candles. This rule applies to both DBR and RBR formations. Here are three methods you can use:
- Method 1: Plot the proximal line at the highest wick of the basing candles. This method gives the highest probability of meeting the entry but comes with the largest monetary risk.
- Method 2 (Preferred Method): Plot the proximal line at the highest body of the basing candles. This method has a lower monetary risk than Method 1 but also a slightly lower probability of meeting the entry.
- Method 3: Plot the proximal line at the lowest body of the basing candles. This method has the smallest monetary risk but the lowest probability of meeting the entry.
Distal Line Placement in a Demand Zone
The way you place the distal line depends on whether you’re dealing with a DBR or an RBR formation.
- Drop-Base-Rally (DBR): Consider the entire formation—look at the leg-in, base, and leg-out. Identify the lowest point of the entire formation and plot the distal line there.
- Rally-Base-Rally (RBR): Ignore the leg-in and focus on the base and leg-out. Identify the lowest point of the base or leg-out, whichever is lower, and plot the distal line there.
Steps to Identify Proximal & Distal Lines of a Supply Zone
Alright, now let’s talk about how to plot the proximal and distal lines of a supply zone. It’s similar to the demand zone, but we’re looking for price drops instead of rallies.
Step 1: Look for the Explosive Drop Candle
- Go from Right to Left: Start by looking at the current price on your chart.
- Start with the Current Price: From there, without cutting through any candles, look up and to the left until you find a strong (explosive) drop in price.
- Identify the Formation: Check if the formation is a Rally-Base-Drop (RBD) or a Drop-Base-Drop (DBD).
Step 2: Check the Supply Zone Formation While Marking the Zone
Now that you’ve found the explosive drop candle, it’s time to mark the zone. Here’s what to watch out for:
- Fresh Zone: The zone should be fresh, meaning it hasn’t been tested by the price before.
- Strong Leg-Out: The leg-out from the base should be strong, indicating a big move.
- Base Candles: There should be no more than six candles in the base. If there are more, the zone might not be valid.
- Draw Proximal & Distal Lines: For every quality zone you find, draw the proximal and distal lines and extend them to the right.
Proximal and Distal Line Placement in a Supply Zone
Now let’s place the proximal and distal lines in the supply zone.
Proximal Line Placement in a Supply Zone
When placing the proximal line in a supply zone, focus only on the base candles. This rule applies to both DBD and RBD formations. Here are three methods you can use:
- Method 1: Plot the proximal line at the lowest wick of the basing candles. This method gives the highest probability of meeting the entry but comes with the largest monetary risk.
- Method 2 (Preferred Method): Plot the proximal line at the lowest body of the basing candles. This method has a lower monetary risk than Method 1 but also a slightly lower probability of meeting the entry.
- Method 3: Plot the proximal line at the highest body of the basing candles. This method has the smallest monetary risk but the lowest probability of meeting the entry.
Distal Line Placement in a Supply Zone
The way you place the distal line depends on whether you’re dealing with an RBD or a DBD formation.
- Rally-Base-Drop (RBD): Consider the entire formation—look at the leg-in, base, and leg-out. Identify the highest point of the entire formation and plot the distal line there.
- Drop-Base-Drop (DBD): Ignore the leg-in and focus on the base and leg-out. Identify the highest point of the base or leg-out, whichever is higher, and plot the distal line there.
No Need to Stress About Plotting Zones—We’ve Got You Covered!
Phew! That was a lot to take in, right? But don’t worry—you don’t have to do all of this manually. Our TradingView indicator takes care of everything for you! 🎉
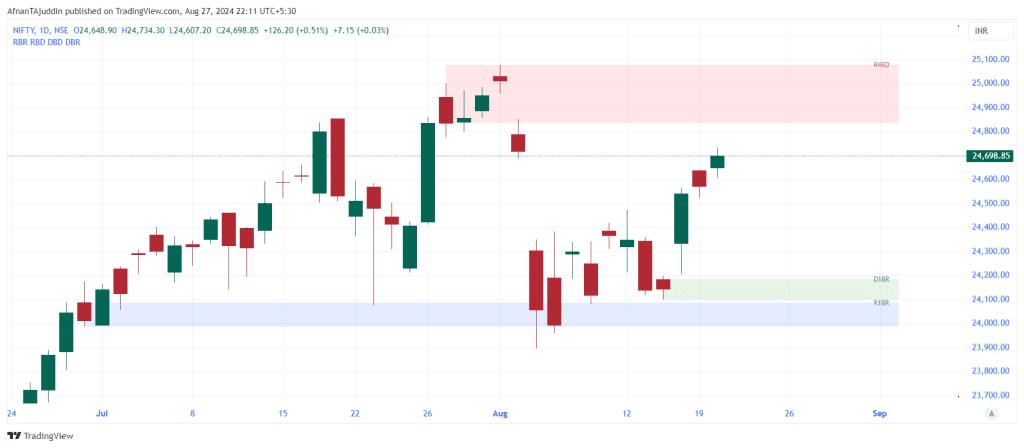
With our Smart Money Demand & Supply Zones Indicator, you can automatically plot accurate demand and supply zones on your chart. The indicator will take care of placing the correct distal and proximal lines, so you don’t have to worry about it.
You can choose which method you want to use for plotting the zone. The default method is Method 2, which focuses on the highest or lowest body of the basing candles. But if you prefer Method 1, you can easily switch to it by turning on the “wick to wick marking” option in the indicator settings.
And the best part? The pricing is super affordable! Check it out here: Market Up2Date Pricing. The image above is a snapshot from TradingView showing how our indicator automatically plots demand and supply zones on your chart. So, why wait? Grab our indicator and let it do the work for you! 🚀📈
Summary
In this article, we learned how to identify and plot the proximal and distal lines of demand and supply zones. These zones help traders spot key areas on the chart where prices might reverse. But if all of this seems like a lot, remember that our TradingView indicator is here to make your life easier by automatically plotting these zones for you. Happy trading! 📊